SourceMod Profiler
The SourceMod profiler is a built-in tool for measuring the performance of SourceMod natives and plugins.
It is currently an "alpha" addition. While it was tested to work, there may be cases where it breaks. Do not use it in a production environment -- it is intended as a tool for developers.
Contents
Introduction
The SourceMod Profiler tracks "profilable items." These items are:
- Native calls from plugins.
- Callbacks into plugins.
- Internal function calls in plugins.
The following statistics are tracked for each item:
- Number calls.
- Total time spent in all calls.
- Minimum time spent in any call.
- Maximum time spent in any call.
These statistics can be used to gauge how well your plugin is performing. It can also be used to tweak and optimize your code where necessary.
Usage
Configuration
The profiler can only be enabled in configs/plugin_settings.cfg. You can enable it on any number of plugins at a time. However, it is a good idea to only profile what you need.
The profiler can be configured with the "profile" option key in an "Options" section. The value should be a bits added up:
- 1 - Profile natives.
- 2 - Profile callbacks.
- 4 - Profile functions (implies 2).
Example for profiling "adminhelp":
	"adminhelp"
	{
		"pause"			"no"
		"lifetime"		"mapsync"

		"Options"
		{
			"debug"		"no"
			"profile"	"7"
		}
	}
Note that one can also use the "*" wildcard (as seen in the default config) in place of a plugin name in order to change the settings of all loaded plugins.
Getting Results
You can use "sm profiler flush" in your console to dump and reset the profiler statistics. The output will be written to an XML file in your sourcemod/logs folder. For example: addons/sourcemod/logs/profile_1204422886.xml (note that a timestamp is included).
There is no way to stop the profiler entirely save from editing plugin_settings.cfg
Interpreting Results
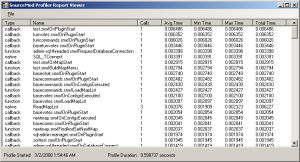
The easiest way to interpret the results is to use the profviewer.exe tool available on SourceMod's downloads page. It requires the .NET 2.0 Framework. You can open profiler .xml files with this tool and sort the various result metrics (descending order only).
- All times are in seconds. The "min" and "max" times are single measurements. The "average" time is the total time spent divided by the number of calls.
- Function names are displayed as raw names for natives, or "a!b" for plugins, where "a" is the plugin filename and "b" is the function name.
It is important to note how the time values are actually computed. You may find the results to be deceiving otherwise. Take the following list of events:
- Core calls OnClientCommand in plugin a.smx
- a.smx!OnClientCommand calls a.smx!StrEqual
- a.smx!StrEqual calls strcmp()
SourceMod computes each item's time by adding in its children's time. For example, the time t(a.smx!OnClientCommand) will be equal to:
t(a.smx!OnClientCommand) + t(a.smx!StrEqual) + t(strcmp)
Likewise, the time of StrEqual will be equal to:
t(a.smx!StrEqual) + t(strcmp)
This has two major implications:
- You cannot profile recursive functions. The data will be nonsensical. Use profiler.inc for manually timing recursive calls.
- The time of re-entrant functions may be deceiving. For example, DisplayMenu() may appear very slow, but that's because it may fire dozens of callbacks. Similarly, the custom sorting natives' time will include their callbacks' time. That doesn't necessarily mean the natives themselves are slow, but that they are slow because of the callbacks they are invoking.
Note: The profiler does not include its own internal operations when timing items. There is a small margin of error, however.
In general, you should not go insane trying to optimize unless there is a good reason. For example, an OnGameFrame callback may be called 200 times per minute, and thus if its average time exceeds reasonable values (say, a dozen milliseconds) then you may want to consider optimizing it. However, if you see that a particular call to LoadTranslations() is taking 150ms, you shouldn't worry too much - that function only gets called on load.
Use your judgment when interpreting the results, and don't go crazy. If you need advice, post on the forums.
File Format
The file format is XML. The contents are fairly self-explanatory, as there are only three elements. Sample parsers are included in the SourceMod source code tree:
- tools/csharp - Source code for the profviewer.exe program. ProfReport.cs implements the parser.
- php/ProfFileParser.class.php - Source code for a PHP parser. Requires PHP5 and libexpat (XML) support.
